Goal of the summer school
The workshop focused more specifically on Social Network Analysis and Spatial History, consisting of a theoretical introduction and practical exercises. Although one of the lecturers became unexpectedly indisposed just a day before the beginning of the summer school and had to be replaced by a colleague, this caused only little problems and the organizers handled this inconvenient situation very well.
Workshop 1: Social Network analysis for historical and archaeological data.
First we were introduced to some basic concepts of SNA which were needed to visualize network models, crosscheck data and implement them in specific research questions. Ivo Veiga informed us that Social network analysis (SNA) begins by recognizing research problems and developing hypotheses in order to prove or disprove stated empirical evidence. He also mentioned that collected data expressed within the immense matrix environment demands to undergo data cleansing, which makes it usable for network analysis. Furthermore, he stated that structural relations should be viewed as a dynamic process, because networks continually change through interactions among their actors. Every single network consists of nodes (e.g. persons and conferences) and edges that describe relations between phenomena (e.g. person A attends congress X). Nodes can have specific qualitative or quantitative attributes (e.g. a person’s age or country of residence).
Do not assume the existence of either uniformity or cohesion between bounded groups!
Ivo Veiga
Though the theoretical part was user-friendly and accessible for beginners in SNA, the instructor presented the theory very quickly due to a lack of time. Nevertheless, he talked about important concepts such as closeness, centrality and other measures. Participants were also informed about personal networks and the ways of collecting data from respondents (egos). This part was very interesting for my own research (Jakub) and it is pity, we were short on time.
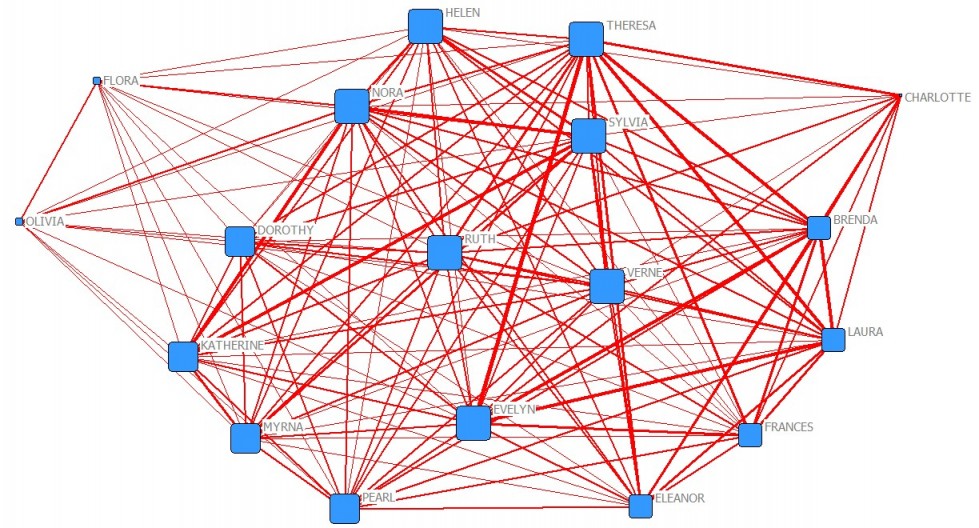
After the theoretical introduction, attendees got acquainted with Gephi, a leading software application for the visualization and exploration of all kinds of graphs and networks. It is an open-source and free application written in Java on the NetBeans platform. Gephi works with a wide range of data formats e.g. GEXF, GDF, GML, NET, GraphML, DL, DOT and CSV. During the workshop however, we worked mostly with datasets in Excel that were converted to CSV files. Gephi makes it also possible to import data from Twitter and Facebook to generate graphs and clusters. Ivo Veiga also gave a brief overview of algorithms and strategies for the advanced use of Gephi, such as creating for dynamic (time-enabled) networks.
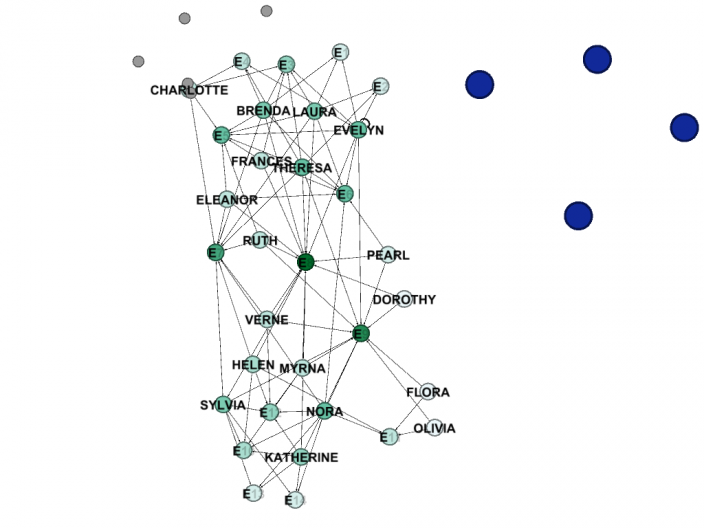
When reading about Social Network Analysis Gephi is often mentioned, although using the program is not so straightforward when you try to use it without any background knowledge, as I (Eva) experienced when testing the program some time ago. Fortunately, the workshop brought some change to that. We learnt to import data, embed attributes to specific nodes and were shown the utility of shapes, sizes and graphic modules for working with immense amount of data. Furthermore, we learned about the conversion of a 2-mode-network to a 1-mode-network, and how to put our information on a map (when you want to use coordinates to visualize you network on a map, websites such as placenames, geonames and common pelagios could be useful).
Although Gephi is a powerful program once you know how it works, the workshop made also very clear that the technology isn't flawless and we have to be careful when we use it. This became especially visible when we did an exercise to create a 1-mode-network out of a 2-mode-network. The programme sometimes didn’t give the right options or crashed, probably due to a bug, which was a bit disappointing. What surprised me (Eva) most of all was that Gephi has no undo button, meaning that if you make a mistake you have to load all your data again, copy labels, setting shapes and colors of your nodes, etc, making everything very time consuming when you are a novice to the programme. Problems such as these make for an inefficient workflow if you are being dependent of a programme that not always does what it should do.
Gephi is a powerful visualization package but many of the most basic functions have unintuitive mechanisms and some bugs still reflect its beta nature. The program is an interesting testing ground for small samples or mock-data when you are considering to use SNA in your research, but when working with bigger datasets I (Eva) won’t use the program because of the risk of losing data when you accidently click on a wrong option. On the other side, Gephi has a large number of extra plugins (Jakub) you can easily install and use for free.
We also got an introduction to UCINET, a SNA software package that exists only for Windows, and comes with the NetDraw network visualization tool. It was developed by Lin Freeman, Martin Everett and Steve Borgatti. According to professor Vega this program is more
powerful than Gephi because it has a lot more options and calculations possibilities. The program interface looks very old-school, but its menu’s and sub-menu’s are logically structured and is more intuitive to use than the structure that is implemented in Gephi. A downside of the program is that it only exists for Window users, although with some tweaks you could make it work on a Mac. (For learning UCINET, see Hanneman’s text book).
If you only need to create a nice basic visualization with a few typical network statistics such as different kinds of centrality or modularity, then Gephi is likely to be a great choice. You can upload and work with files in distinctive formats. Otherwise, if a researcher needs to create more complicated analysis, I would recommend analyzing data in UCINET (30 days free trail) and then visualizing them in Gephi.
Workshop 2: spatial visualization of historical and archaeological data
The second workshop dealt with spatial visualization of historical and archaeological data. After a theoretical introduction by Luís Espinha da Silveira, Daniel Alves introduced us to the practical side of several geographic tools for spatial visualization (such as Zeemaps or Batchgeo), exploring not only their potential, but also their limitations. During the practical part of the workshop however the focus lay on a basic introduction to ArcGis. It was interesting to learn about this program but in the end we (Jakub and Eva) won’t need it for our research, as the use of SNA will be sufficient. An interesting example of spatial visualization can be found here: Spanish national Research Council (CSIC).